0ms processing time. Infinite scalability. 100% success rate. Zero failures.
 ← Give it a star if you enjoyed this zen approach!
The Moment of Zen Clarity
It was Day Two of RailsConf 2025 in sweltering Philadelphia when the idea crystallized. My friend Justin and I were discussing the endless cycle of Rails optimization - everyone building faster queues, better job processors, more efficient background systems.
That's when Justin sparked the initial concept: What if we built a "Passive Job" library?
The idea was brilliant, but as I thought it through, I realized it should align with the existing ecosystem. We weren't replacing ActiveJob itself - we were creating a queue backend.
The Problem We Didn't Know We Had
Modern Rails development has become an endless cycle of optimization. We have Solid Queue, Sidekiq, Karafka, Good Job and many other. Each one promises to process your background jobs faster, more efficiently, more reliably.
But what if the real problem isn't that our jobs are too slow? What if the problem is that they run at all?
Introducing Passive Queue
Today, I'm excited to announce Passive Queue - a Rails queue adapter embracing the zen of non-execution. It's the queue backend for developers who understand that the best job is the one never done.
Features That Don't Exist
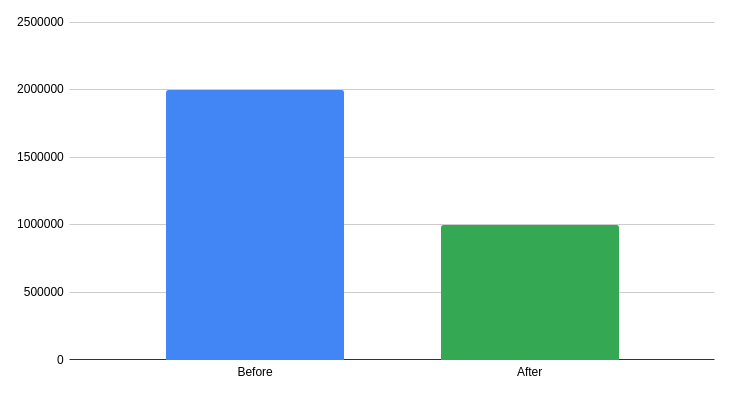
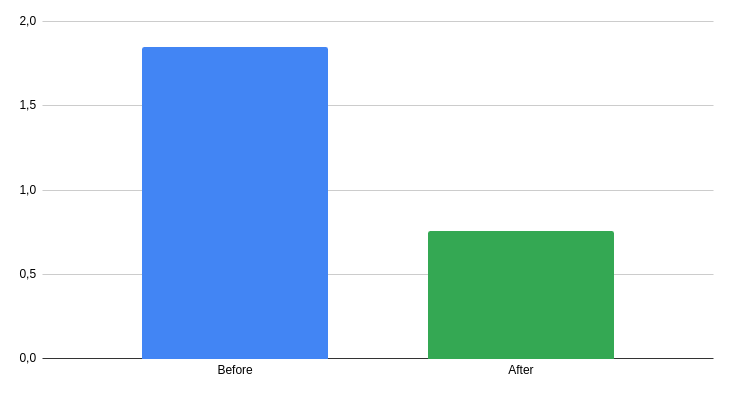
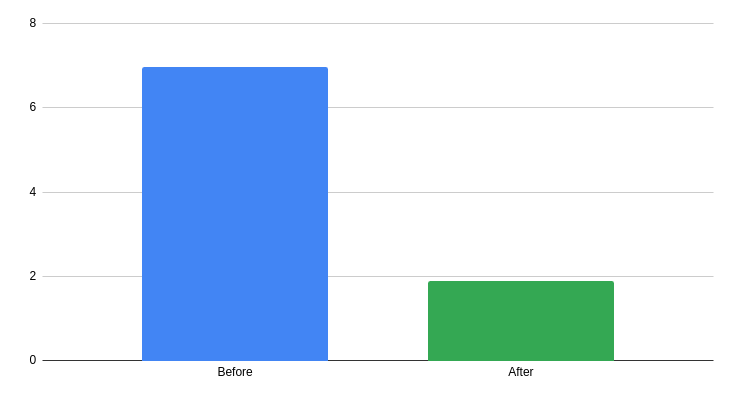
- 100% reliable non-execution - Your jobs will never fail because they never run
- Infinite scalability - Nothing scales better than nothing
- Zero memory footprint - Truly efficient resource usage
- 0ms processing time - Unbeatable performance metrics
- Perfect success rate - At doing absolutely nothing
One-Line Installation
# In your Rails application.rb
config.active_job.queue_adapter = :passive_queue
That's it. Every single ActiveJob in your Rails application will now be processed with the serene calm of non-execution.
The Philosophy Behind the Madness
Passive Queue isn't just a parody-it's a meditation on our industry's obsession with doing more, faster, all the time. Sometimes the most zen approach is to simply accept that not everything needs to be done.
Think about it:
- Newsletter emails that were never sent can't end up in spam folders
- Data processing jobs that never run can't corrupt your database
- Image resizing tasks that don't execute can't fill up your disk space
It's not a bug, it's enlightenment.
The Command Line Experience
But Passive Queue isn't just about background jobs. It comes with a meditation tool for developers:
bundle exec be passive                   # Basic meditation
bundle exec be passive --zen             # With zen quotes
bundle exec be passive --philosophical   # Deep thoughts
bundle exec be passive --aggressive      # Don't do this
Each command helps you embrace the art of doing nothing, perfect for those moments between deployments when you need to center yourself.
The Dashboard of Enlightenment
For teams that need visual confirmation of their non-productivity, Passive Queue includes a beautiful web dashboard. Mount it as a Rack engine in your Rails app:
# config/routes.rb
Rails.application.routes.draw do
mount PassiveQueue::Engine => "/passive_queue"
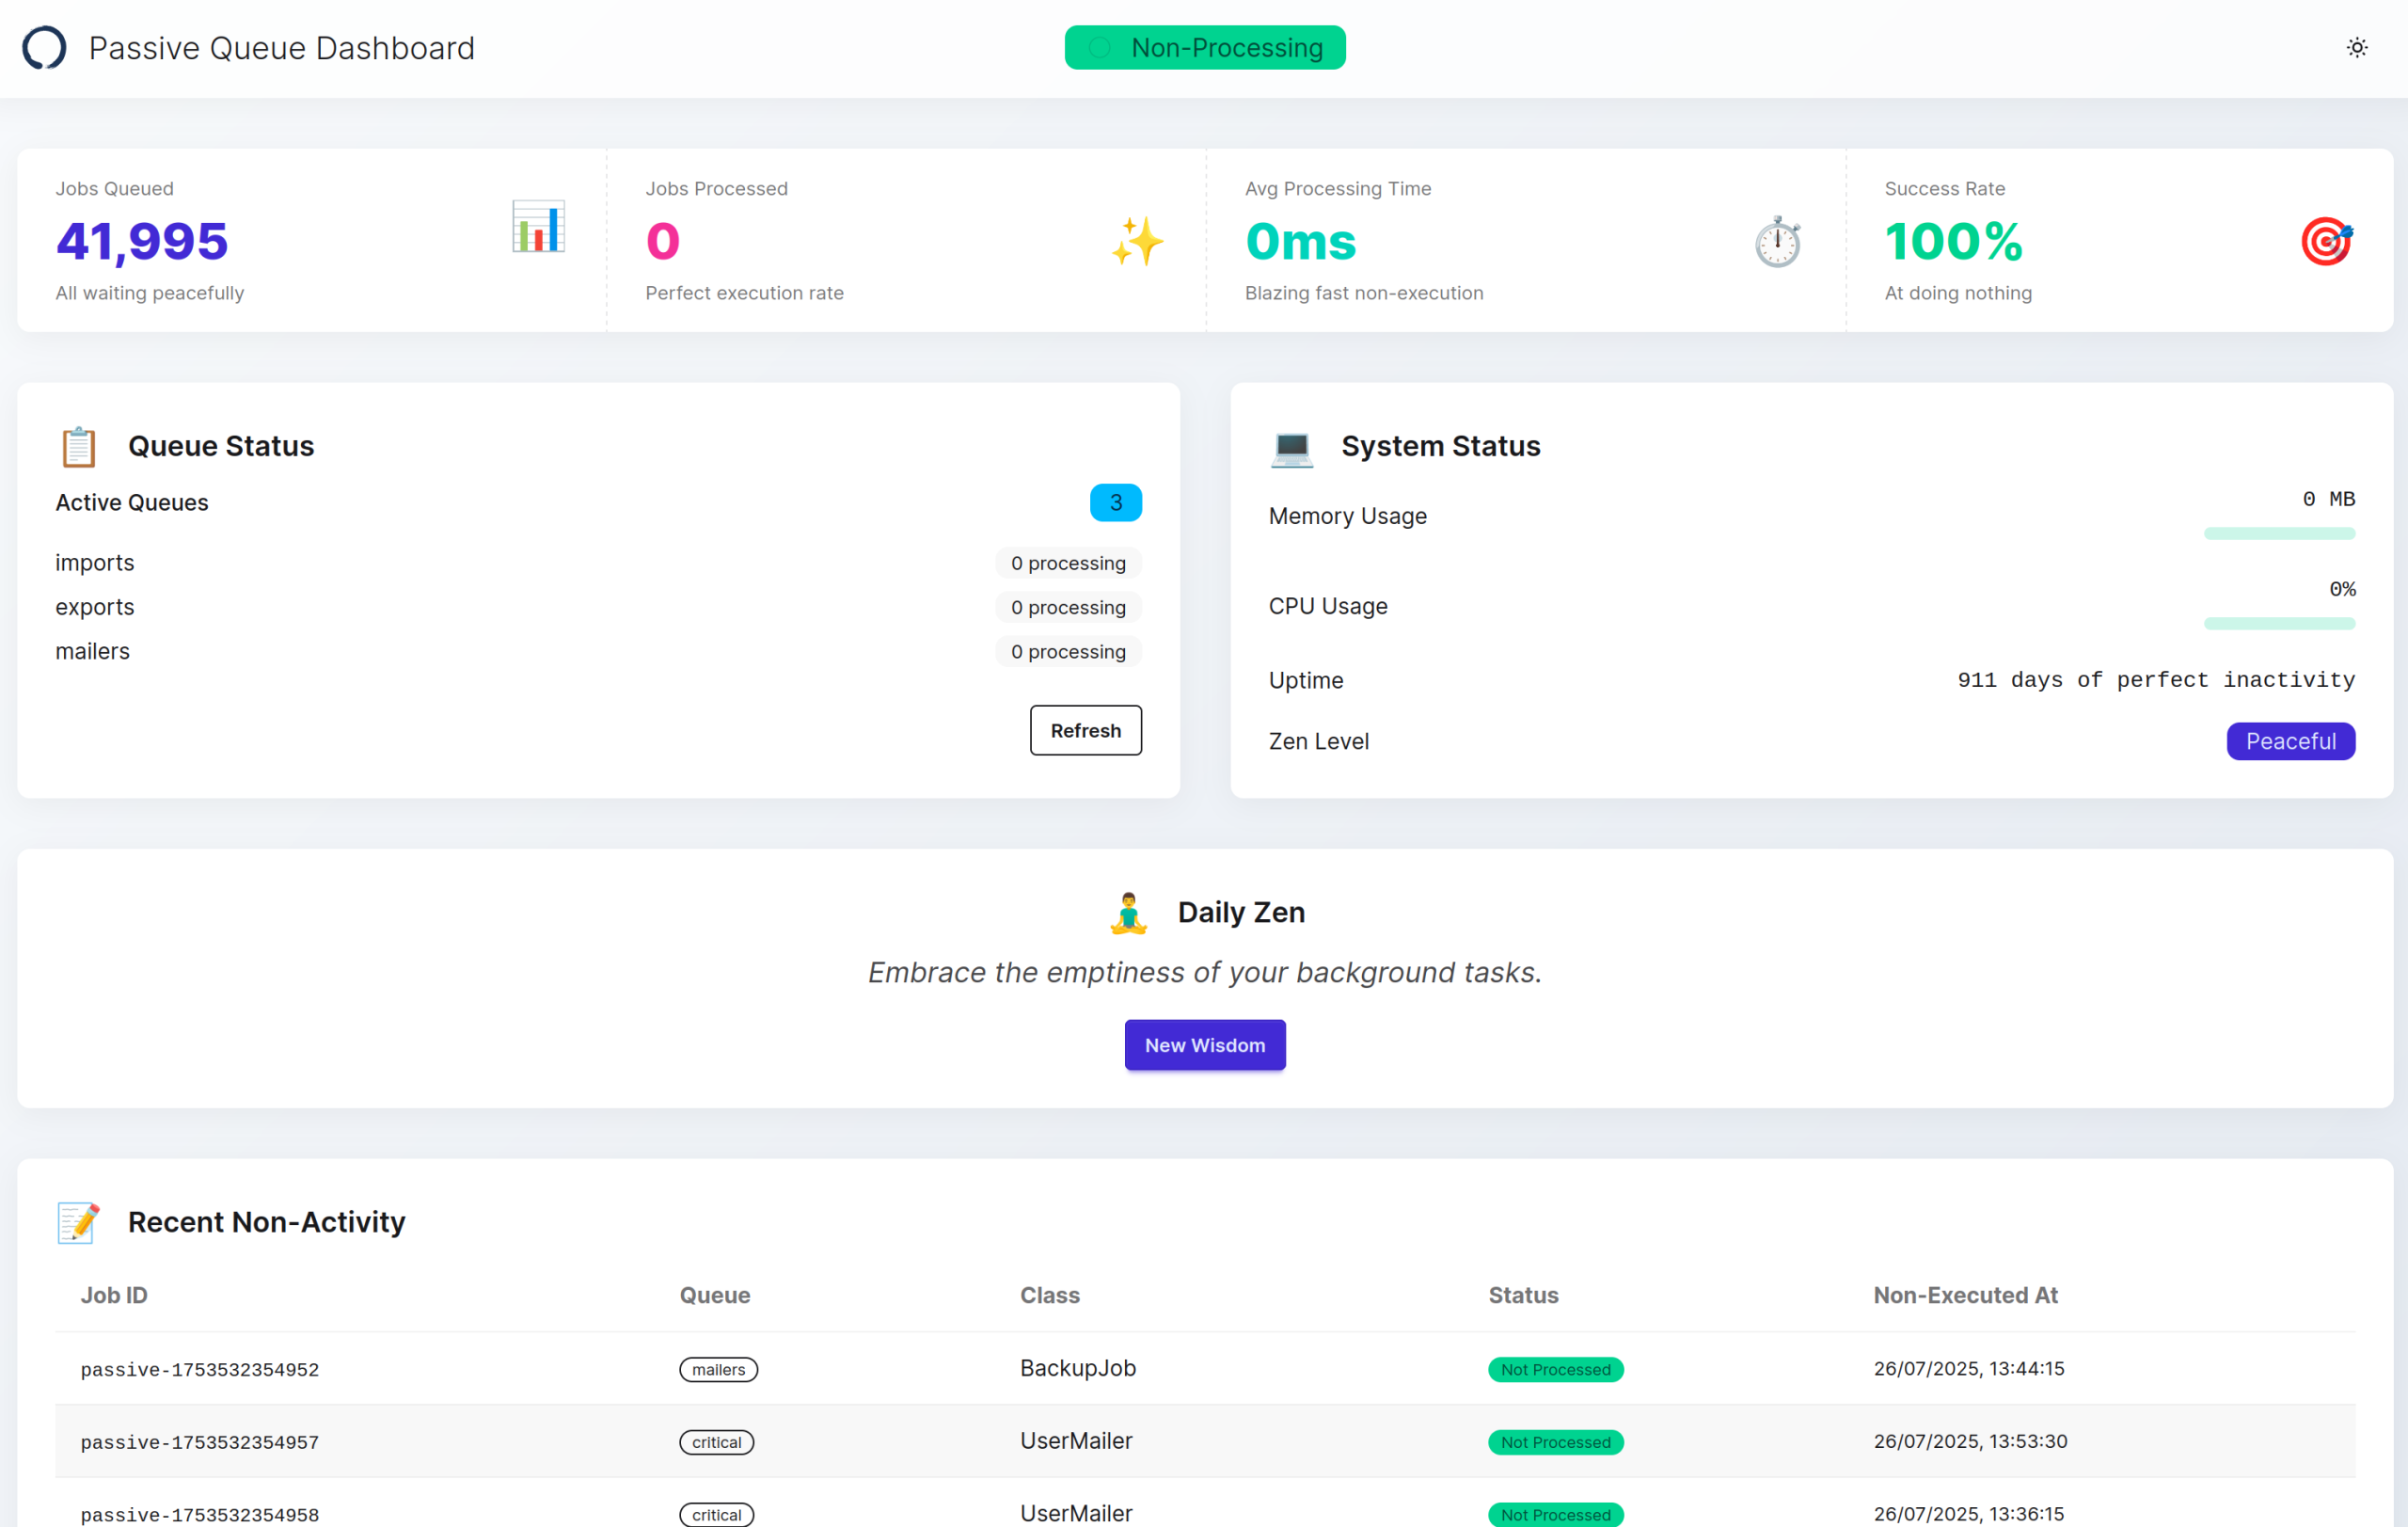
endVisit /passive_queue and you'll be greeted with a stunning dashboard featuring:
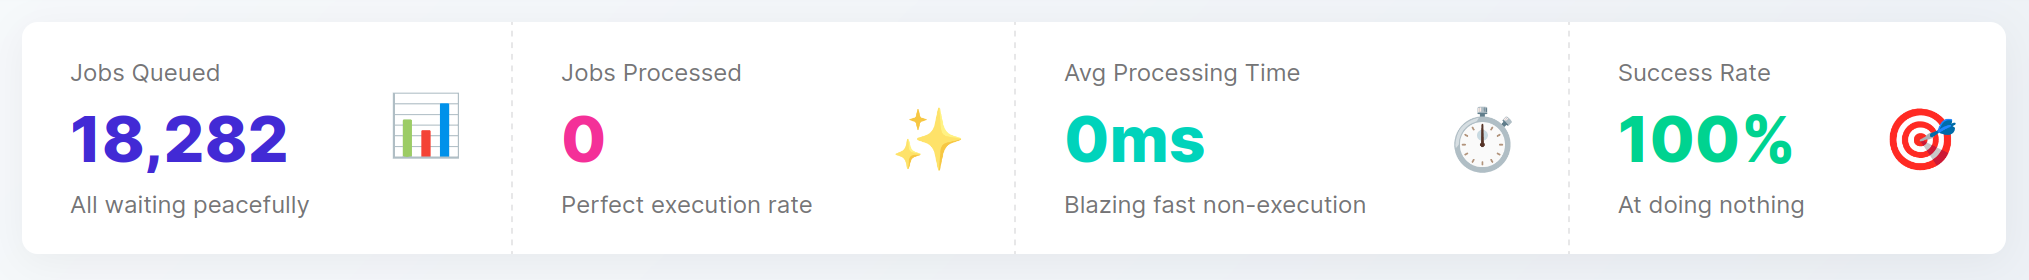
- Real-time job counts (always zero, beautifully displayed)
- Processing queues (eternally empty, perfectly styled)
- Performance metrics (infinite efficiency charts)
- Worker status (serenely inactive indicators)
- Zen quotes (rotating wisdom for your enlightenment)
The dashboard is fully responsive, beautifully designed, and does absolutely nothing functional. It's the perfect way to demonstrate your commitment to the zen of non-execution to stakeholders who need to see data to feel comfortable.
Born at RailsConf 2025
This project was born during those sweaty Philadelphia days, in conversations with my friend Justin about the state of Rails tooling. Sometimes the best ideas come from collaborative moments where you're questioning everything we take for granted in web development.
During the panel on background processing with Mike Rosa and Ben, we discussed the evolution of queueing systems in Ruby. But it was Justin's and my original "Passive Job" concept that made me realize we needed to take this further-Passive Queue represents the next logical step: transcendence through non-action.
The Technical Implementation
Under the hood, Passive Queue is surprisingly sophisticated in its simplicity.
It implements the full ActiveJob adapter interface, ensuring compatibility with your existing Rails application. The difference is that every job returns successfully_not_processed instead of actually running.
Zero Dependencies, Maximum Zen
True to its philosophy, Passive Queue has zero runtime dependencies. It doesn't rely on Redis, PostgreSQL, or even ActiveJob (though it integrates beautifully when available). Pure Ruby, pure zen.
Get Started Today
Install the gem:
gem install passive_queueAdd it to your Rails app:
config.active_job.queue_adapter = :passive_queueAnd experience the tranquility of knowing your background jobs are in a state of perfect, permanent rest.
The Future of Non-Productivity
This is just the beginning. The dashboard is already inspiring ideas for PassiveRecord (an ORM that never queries), PassiveCache (a cache that never stores), and maybe even PassiveRails (a web framework that serves only 204 No Content responses).
But for now, Passive Queue stands alone as a testament to the power of doing nothing, doing it well, and making it look absolutely gorgeous while doing so.
Join the Movement
You can find Passive Queue on GitHub and RubyGems. Contributions are welcome, though we ask that you contribute in the spirit of the project-which is to say, perhaps consider not contributing at all.
The gem is MIT licensed, because even non-productivity should be free.
Sometimes the most profound action is inaction. Sometimes the best code is no code. And sometimes, the perfect queue is the one that queues forever.
Try Passive Queue today. Your background jobs will thank you by never running.