Table of Contents
For the past several weeks, I've been trying to fix a cranky spec in Karafka integrations suite, which in the end, lead me to become a Ruby on Rails micro-contributor and submitting similar fix to several other high-popularity projects from the Ruby ecosystem. Here's my story of trying to make sense of my specs and Ruby concurrency.
Ephemeral bug from a test-suite
Karafka is a Ruby and Rails multi-threaded efficient Kafka processing framework. To provide reliable OSS that is multi-threaded, I had to have the option to run my test suite concurrently to simulate how Karafka operates. Since it was a specific use case, I created my micro-framework.
Long story short: It runs end-to-end integration specs by running them in separate Ruby processes. Each starts Karafka, runs all the code in various configurations, connects to Kafka, checks assertions, and at the end, shuts down.
Such an approach allowed me to ensure that the process's whole lifecycle and its components work as expected. Specs are started with supervision, so in case of any hang, it will be killed after 5 minutes.
Karafka itself also has an internal shutdown supervisor. In case of a user shutdown request, if the shutdown takes longer than the defined expected time, Karafka will stop despite having things running. And this is what was happening with this single spec:
E, [2022-11-19T16:47:49.602718 #14843] ERROR -- : Forceful Karafka server stop
F, [2022-11-19T16:47:49.602825 #14843] FATAL -- : #<Karafka::Core::Monitoring::Event:0x0000562932d752b0 @id="error.occurred", @payload={:caller=>Karafka::Server, :error=>#<Karafka::Errors::ForcefulShutdownError: Karafka::Errors::ForcefulShutdownError>, :type=>"app.stopping.error"}>
This damn spec did not want to stop!
Many things are working under the hood:
- workers that process jobs that could hang and force the process to wait
- jobs queue that is also connected to the polling thread (to poll more data when no work is to be done)
- listeners that poll data from Kafka that could hang
- consumer groups with several threads polling Kafka data that might get stuck because of some underlying error
- Other bugs in the coordination of work and states.
One thing that certainly worked was the process supervision that would forcefully kill it after 30 seconds.
Process shutdown coordination
The graceful shutdown of such a process takes work. When you have many connections to Kafka, upon a poorly organized shutdown, you may trigger several rebalances that may cause short-lived topics assignments causing nothing except friction and potentially blocking the whole process.
To mitigate this, Karafka shuts down actively and gracefully. That is, until the absolute end, it claims the ownership of given topics and partitions, actively waiting for all the current work to be finished. This looks more or less like so:
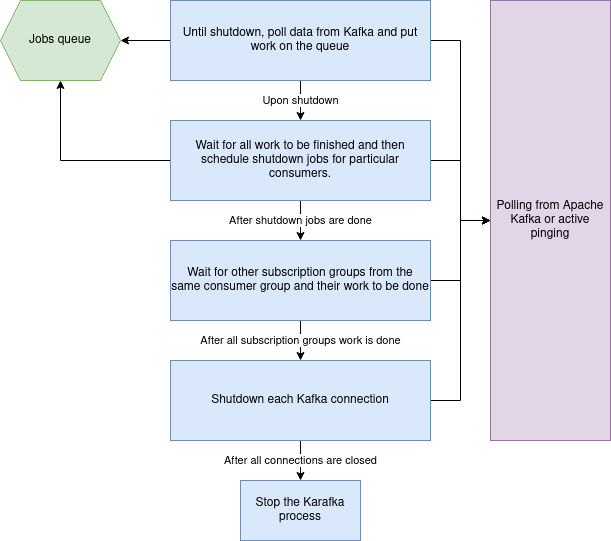
Note: Consumer groups internally in Karafka are a bit different than Kafka consumer groups. Here we focus on internal Karafka concepts.
Pinpointing the issue
After several failed attempts and fixing other bugs, I added a lot of extra instrumentation to check what Karafka hangs on. It was hanging because there were hanging listener threads!
As stated above, to close Karafka gracefully, all work from the jobs queue needs to be finished, and listeners that poll data from Kafka need to be able to exit the polling loops. It's all coordinated using a job queue. The job queue we're using is pretty complex with some blocking capabilities, and you can read about it here, but the interesting part of the code can be reduced to this:
@semaphores = Concurrent::Map.new { |h, k| h[k] = Queue.new }Those queues are used as semaphores in the polling loops until all the current work is done. Since each Queue is assigned to a different subscription group within its thread and hidden behind a concurrent map, there should be no problem. Right?

Reproduction
Once I had my crazy suspicion, I decided to reduce it down to a proof of concept:
require 'concurrent-ruby'
100.times do
ids = Set.new
semaphores = Concurrent::Hash.new { |h, k| h[k] = Queue.new }
100.times.map do
Thread.new do
ids << semaphores['test'].object_id
end
end.each(&:join)
raise "I expected 1 semaphore but got #{ids.size}" if ids.size != 1
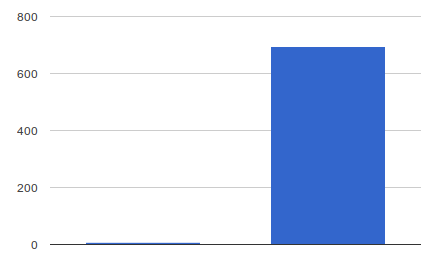
endonce executed, boom:
poc.rb:13:in `<main>': I expected 1 semaphore but got 2 (RuntimeError)There is more than one semaphore for one listener! This caused Karafka to wait until forced to stop because the worker thread would use a different semaphore than the listener thread.
But how is that even possible?
Well, Concurrent::Hash and Concurrent::Map initialization is indeed thread-safe but not precisely as you would expect them to be. The docs state that:
This version locks against the object itself for every method call, ensuring only one thread can be reading or writing at a time. This includes iteration methods like #each, which takes the lock repeatedly when reading an item.
"only one thread can be reading or writing at a time". However, we are doing both at different times. Our code:
semaphores = Concurrent::Hash.new { |h, k| h[k] = Queue.new }is actually equivalent to:
semaphores = Concurrent::Hash.new do |h, k|
  queue = Queue.new
  h[k] = queue
end
and the block content is not locked fully. One threads queue can overwrite the other if the Ruby scheduler stops the execution in the middle. Here's the flow of things happening in the form of a diagram:
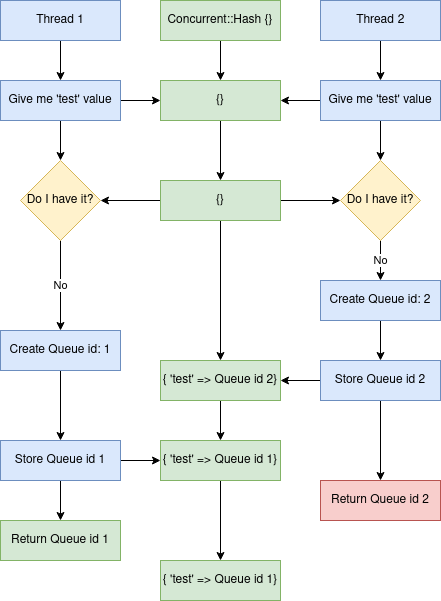
Once in a while listener would receive a dangling queue object, effectively blocking the polling process.

Fixing the issue
This can be fixed either by replacing the Concurrent::Hash with Concurrent::Map and using the #compute_if_absent method or by introducing a lock inside of the Concurrent::Hash initialization block:
Concurrent::Map.new do |k, v|
  k.compute_if_absent(v) { [] }
end

mutex = Mutex.new

Concurrent::Hash.new do |k, v|
  mutex.synchronize do
    break k[v] if k.key?(v)
    k[v] = []
  end
end
Okay, but what does Ruby on Rails and other projects do with all of this?
Fixing the world
I figured out that if I made this mistake, maybe others did. I decided to check my local gems to find occurrences quickly. Inside my local gem cache, I executed the following code:
fgrep -R 'Concurrent::Hash.new {' ./
fgrep -R 'Concurrent::Hash.new do' ./
fgrep -R 'Concurrent::Map.new {' ./
fgrep -R 'Concurrent::Map.new do' ./
and validated that I'm not an isolated case. I wasn't alone!
Then using Sourcegraph I pinpointed a few projects that had the potential for fixes:
- rails (activesupport and actionview)
- i18n
- dry-schema
- finite_machine
- graphql-ruby
- rom-factory
- apache whimsy
- krane
- puppet
I am not a domain expert in any of those, and understanding the severity of each was beyond my time constraints, but I decided to give it a shot.
Rails (ActiveSupport and ActionView)
Within Rails, this "pattern" was used twice: in ActiveSupport and ActionView.
In ActionView, it was used within a cache:
PREFIXED_PARTIAL_NAMES = Concurrent::Map.new do |h, k|
  h[k] = Concurrent::Map.new
end
and assuming that the cached result is stateless (same result each time for the same key), the issue could only cause an extra computation upon first parallel requests to this cache.
In the case of ActiveSupport, none of the concurrency code was needed, so I just replaced it with a simple Hash.
Both, luckily, were not that severe, though worth fixing nonetheless.
PR: https://github.com/rails/rails/pull/46536
PR: https://github.com/rails/rails/pull/46534
Both were merged, and this is how I became a Ruby on Rails contributor :)
i18n
This case was slightly more interesting because the concurrent cache stores all translations. In theory, this could cause similar leakage as in Karafka, effectively losing a language by loading it to a different Concurrent::Hash:
100.times.map do
  Thread.new do
    I18n.backend.store_translations(rand.to_s, :foo => { :bar => 'bar', :baz => 'baz' })
  end
end.each(&:join)

I18n.available_locales.count #=> 1
This could lead to hard-to-debug problems. Once in a while, your system could raise something like this:
:en is not a valid locale (I18n::InvalidLocale)without an apparent reason, and this problem would go away after a restart.
PR: https://github.com/ruby-i18n/i18n/pull/644
dry-schema
Another cache case where the risk would revolve around double-computing.
PR: https://github.com/dry-rb/dry-schema/pull/440
rom-factory
This one is interesting! Let's reduce the code to a smaller POC first and see what will happen under heavy threading:
require 'singleton'
require 'concurrent-ruby'

class Sequences
  include Singleton

  attr_reader :registry

  def initialize
    reset
  end

  def next(key)
    registry[key] += 1
  end

  def reset
    @registry = Concurrent::Map.new { |h, k| h[k] = 0 }
    self
  end
end

seq = Sequences.instance

loop do
  100.times.map do
    Thread.new { seq.next('boom') }
  end.each(&:join)

  size = seq.registry['boom']

  raise "Wanted 100 but got #{size}" unless size == 100

  seq.reset
end
poc.rb:37:in `block in <main>': Wanted 100 but got 1 (RuntimeError)The counter value gets biased. What is even more interesting is that making the map safe won't be enough:
@registry = Concurrent::Map.new { |h, k| h.compute_if_absent(k) { 0 } }poc.rb:36:in `block in <main>': Wanted 100 but got 55 (RuntimeError)there is one more "unsafe" method:
def next(key)
  registry[key] += 1
end
this operation also is not atomic, thus needs to be wrapped with a mutex:
def initialize
  @mutex = Mutex.new
  reset
end

def next(key)
  @mutex.synchronize do
    registry[key] += 1
  end
end
Only then is this code safe to be used.
https://github.com/rom-rb/rom-factory/pull/80
Other repositories
- finite-machine: https://github.com/piotrmurach/finite_machine/pull/77
- graphql-Ruby: https://github.com/rmosolgo/graphql-ruby/pull/4251
- Apache Whimsy: https://github.com/apache/whimsy/pull/169
- Puppet: https://github.com/puppetlabs/puppet/pull/8951
- Shopify Krane: https://github.com/Shopify/krane/pull/911
- Issue reported in the concurrent-ruby repo: https://github.com/ruby-concurrency/concurrent-ruby/issues/970
Summary
In my opinion, there are a few outcomes of this story:
- Karafka has a solid test-suite!
- If you are doing concurrency-related work, you better test it in a multi-threaded environment and test it well.
- Concurrency is hard to many of us (maybe that's because we are special ;) ).
- RTFM and read it well :)
- Do not be afraid to help others by submitting pull requests!
On the other hand, looking at the frequency of this issue, it may be worth opening a discussion about changing this behavior and making the initialization fully locked.
Afterwords
Concurrent::Hash under cRuby is just a Hash. You can check it out here.
Cover photo by James Broad on Attribution-NonCommercial-ShareAlike 2.0 Generic (CC BY-NC-SA 2.0). Image has been cropped.