Ruby developers have faced an uncomfortable truth for years: when you need to talk to external systems like Kafka, you're going to block. Sure, you could reach for heavyweight solutions like EventMachine, Celluloid, or spawn additional threads, but each comes with its own complexity tax.
EventMachine forces you into callback hell. Threading introduces race conditions and memory overhead. Meanwhile, other ecosystems had elegant solutions: Go's goroutines, Node.js's event loops, and Python's asyncio.
Ruby felt clunky for high-performance I/O-bound applications.
Enter the Async Gem
Samuel Williams' async gem brought something revolutionary to Ruby: lightweight concurrency that actually feels like Ruby. No callbacks. No complex threading primitives. Just fibers.
require 'async'

Async do |task|
  # These run concurrently
  task1 = task.async { fetch_user_data }
  task2 = task.async { fetch_order_data }
  task3 = task.async { fetch_metrics_data }

  [task1, task2, task3].each(&:wait)
end
The genius is in the underlying architecture. When an I/O operation would normally block, the fiber automatically yields control to other fibers – no manual coordination is required.
Why Lightweight Concurrency Matters
Traditional threading and evented architectures are heavy. Threads consume a significant amount of memory (1MB stack per thread) and come with complex synchronization requirements. Event loops force you to restructure your entire programming model.
Fibers are lightweight:
- Memory efficient: Kilobytes instead of megabytes
- No synchronization complexity: Cooperative scheduling
- Familiar programming model: Looks like regular Ruby code
- Automatic yielding: Runtime handles I/O coordination
WaterDrop: Built for Async
Starting with the 2.8.7 release, every #produce_sync and #produce_many_sync operation in WaterDrop automatically yields during Kafka I/O. You don't configure it. It just works:
require 'async'
require 'waterdrop'

producer = WaterDrop::Producer.new do |config|
  config.kafka = { 'bootstrap.servers': 'localhost:9092' }
end

Async do |task|
  # These run truly concurrently
  user_events = task.async do
    100.times do |i|
      producer.produce_sync(
        topic: 'user_events',
        payload: { user_id: i, action: 'login' }.to_json
      )
    end
  end

  # This also runs concurrently during Kafka I/O
  metrics_task = task.async do
    collect_application_metrics
  end

  [user_events, metrics_task].each(&:wait)
end
Real Performance Impact
Performance Note: These benchmarks show single-message synchronous production (
produce_sync) for clarity. WaterDrop also supports batch production (produce_many_sync), async dispatching (produce_async), and promise-based workflows. When combined with fibers, these methods can achieve much higher throughput than shown here.
I benchmarked a Rails application processing 10,000 Kafka messages across various concurrency patterns:
Sequential processing (baseline):
- Total time: 62.7 seconds
- Throughput: 160 messages/second
- Memory overhead: Baseline
Single fiber (no concurrency):
- Total time: 63.2 seconds
- Throughput: 158 messages/second
- Improvement: 0.99x - No benefit without actual concurrency
Real-world scenario (3 concurrent event streams):
- Total time: 23.8 seconds
- Throughput: 420 messages/second
- Improvement: 2.6x - What most applications will see in production
Optimized fiber concurrency (controlled batching):
- Total time: 12.6 seconds
- Throughput: 796 messages/second
- Improvement: 5.0x - Peak performance with proper structure
Multiple producers (traditional parallelism):
- Total time: 15.2 seconds
- Throughput: 659 messages/second
- Improvement: 4.1x - Good, but uses more memory than fibers
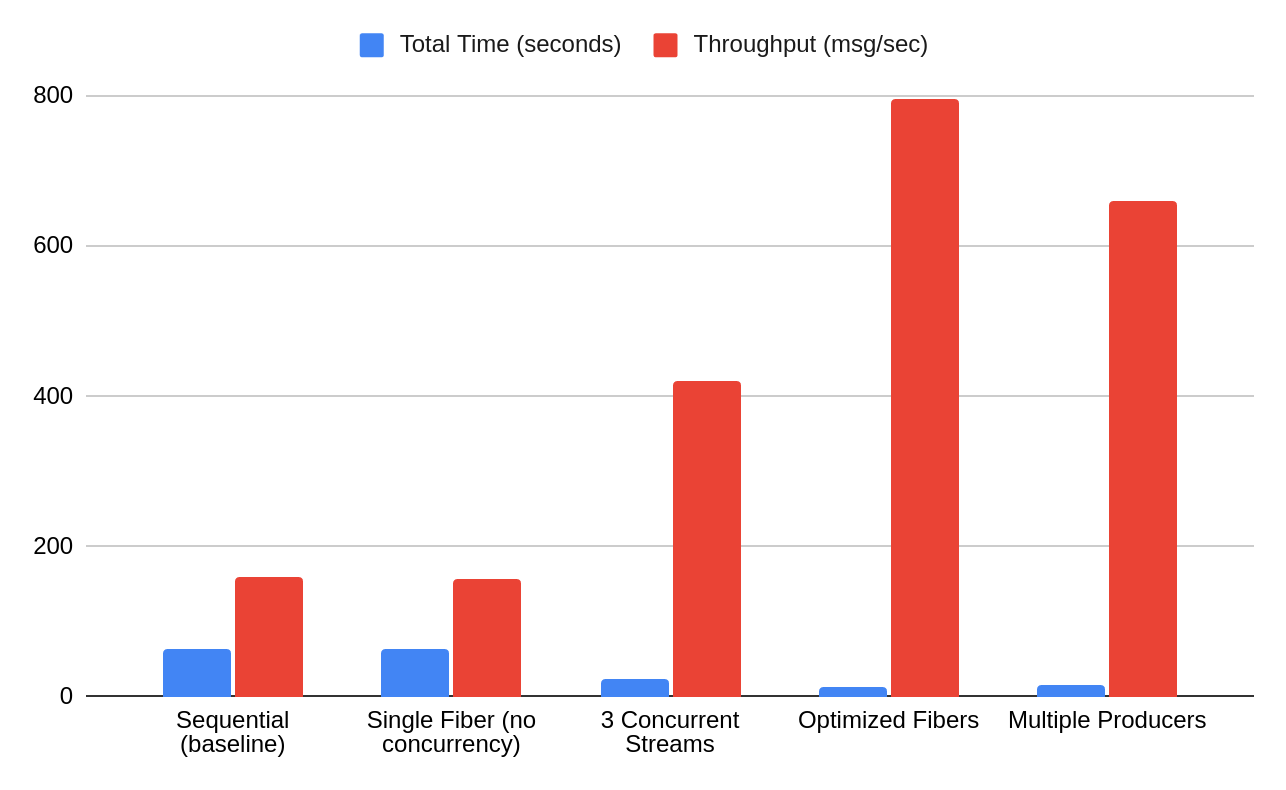
A single producer using fibers outperforms multiple producer instances (5.0x vs 4.1x) while using less memory and resources. This isn't about making individual operations faster - it's about enabling Ruby to handle concurrent I/O elegantly and efficiently.
Transparent Integration
What makes WaterDrop's async integration cool is that it's completely transparent:
# This code works with or without async
producer.produce_sync(
  topic: 'events',
  payload: data.to_json
)
Running in a fiber scheduler? It yields during I/O. Running traditionally? It blocks normally. No configuration. No special methods.
The Transactional Reality
Transactions have limitations. Multiple transactions from one producer remain sequential due to the transactional.id design:
# These transactions will block each other
Async do |task|
  task.async { producer.transaction { ... } }
  task.async { producer.transaction { ... } } # Waits for first
endBut: transactions still yield during I/O, allowing other fibers doing different work to continue. For concurrent transactions, use separate producers.
Real-World Example
class EventProcessor
  def process_user_activity(sessions)
    Async do |task|
      # Process different types concurrently
      login_task = task.async { process_logins(sessions) }
      activity_task = task.async { process_activity(sessions) }

      # Analytics runs during Kafka I/O
      analytics_task = task.async { update_analytics(sessions) }

      [login_task, activity_task, analytics_task].each(&:wait)
    end
  end

  private

  def process_logins(sessions)
    sessions.each do |session|
      producer.produce_sync(
        topic: 'user_logins',
        payload: session.to_json
      )
    end
  end
end
Why This Matters
WaterDrop's async integration proves Ruby can compete in high-performance I/O scenarios without sacrificing elegance. Combined with Samuel's broader ecosystem (async-http, async-postgres, falcon), you get a complete stack for building high-performance Ruby applications.
Try wrapping any I/O-heavy operations in Async do |task| blocks. Whether it's API calls, database queries, or Kafka operations with WaterDrop, the performance improvement may be immediate and dramatic.
Find WaterDrop on GitHub and explore the async ecosystem that's making Ruby fast again.